I recently setup Grafana / Prometheus / NodeExporter to collect some data from my home server. And I got some very interesting results. Bellow is graph of HDD busy time during scrub on 5 disks ZFS pool.
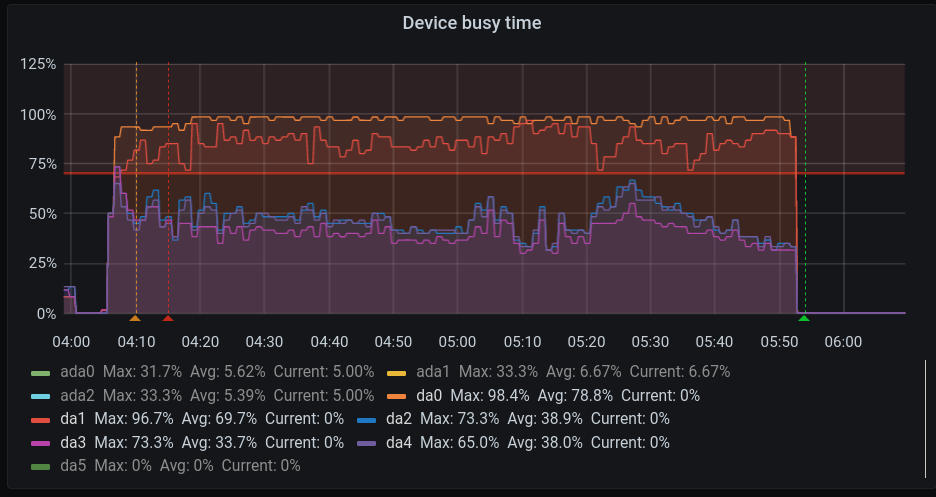
All disk were getting same amount of IO. Average read speed is virtually same on all 5 disks. But two disks da0 and da1 are busy pretty much to 100%. While other one are hanging around 50%.
Disk models are:
- da0/da1 - Seagate IronWolf ST2000VN004-2E4164
- da2/da4 - Seagate NAS HDD ST3000VN000-1HJ166
- da3 - Seagate Barracuda 7200.14 (AF) ST3000DM001-1CH166
Clearly Iron Wolfs are under-performing while been youngest of them all. And not - it is not a problem with 4k sector alignment.